The Dashboard
The dashboard is the product. Everything else in MediaWatch exists to keep this one Discord message current.
One message, updated in place
MediaWatch does not post a new message per update. It creates the dashboard once and edits that same message from then on, so the channel stays a single message deep no matter how long the bot runs.
The message ID is written to data/dashboard_message_id.json:
That file is why a restart does not produce a second dashboard. What follows from it:
- The embed is rebuilt and the message edited once per minute.
- If the message was deleted, the bot logs
Dashboard message not found, creating new one, posts a fresh one and stores the new ID. - To move the dashboard to another channel, change
CHANNEL_IDand restart. The stored ID is not found in the new channel, so the bot posts a fresh dashboard there. The old message stays behind in the old channel, frozen; delete it by hand.
The bot must be able to edit its own message
If the bot loses permission to the channel, the update is logged as a failure and the old embed simply freezes. A stale "Last updated" timestamp in the footer is the first symptom. Once permission is back, the bot posts a new dashboard instead of resuming the old one; delete the frozen message by hand.
When the server is online
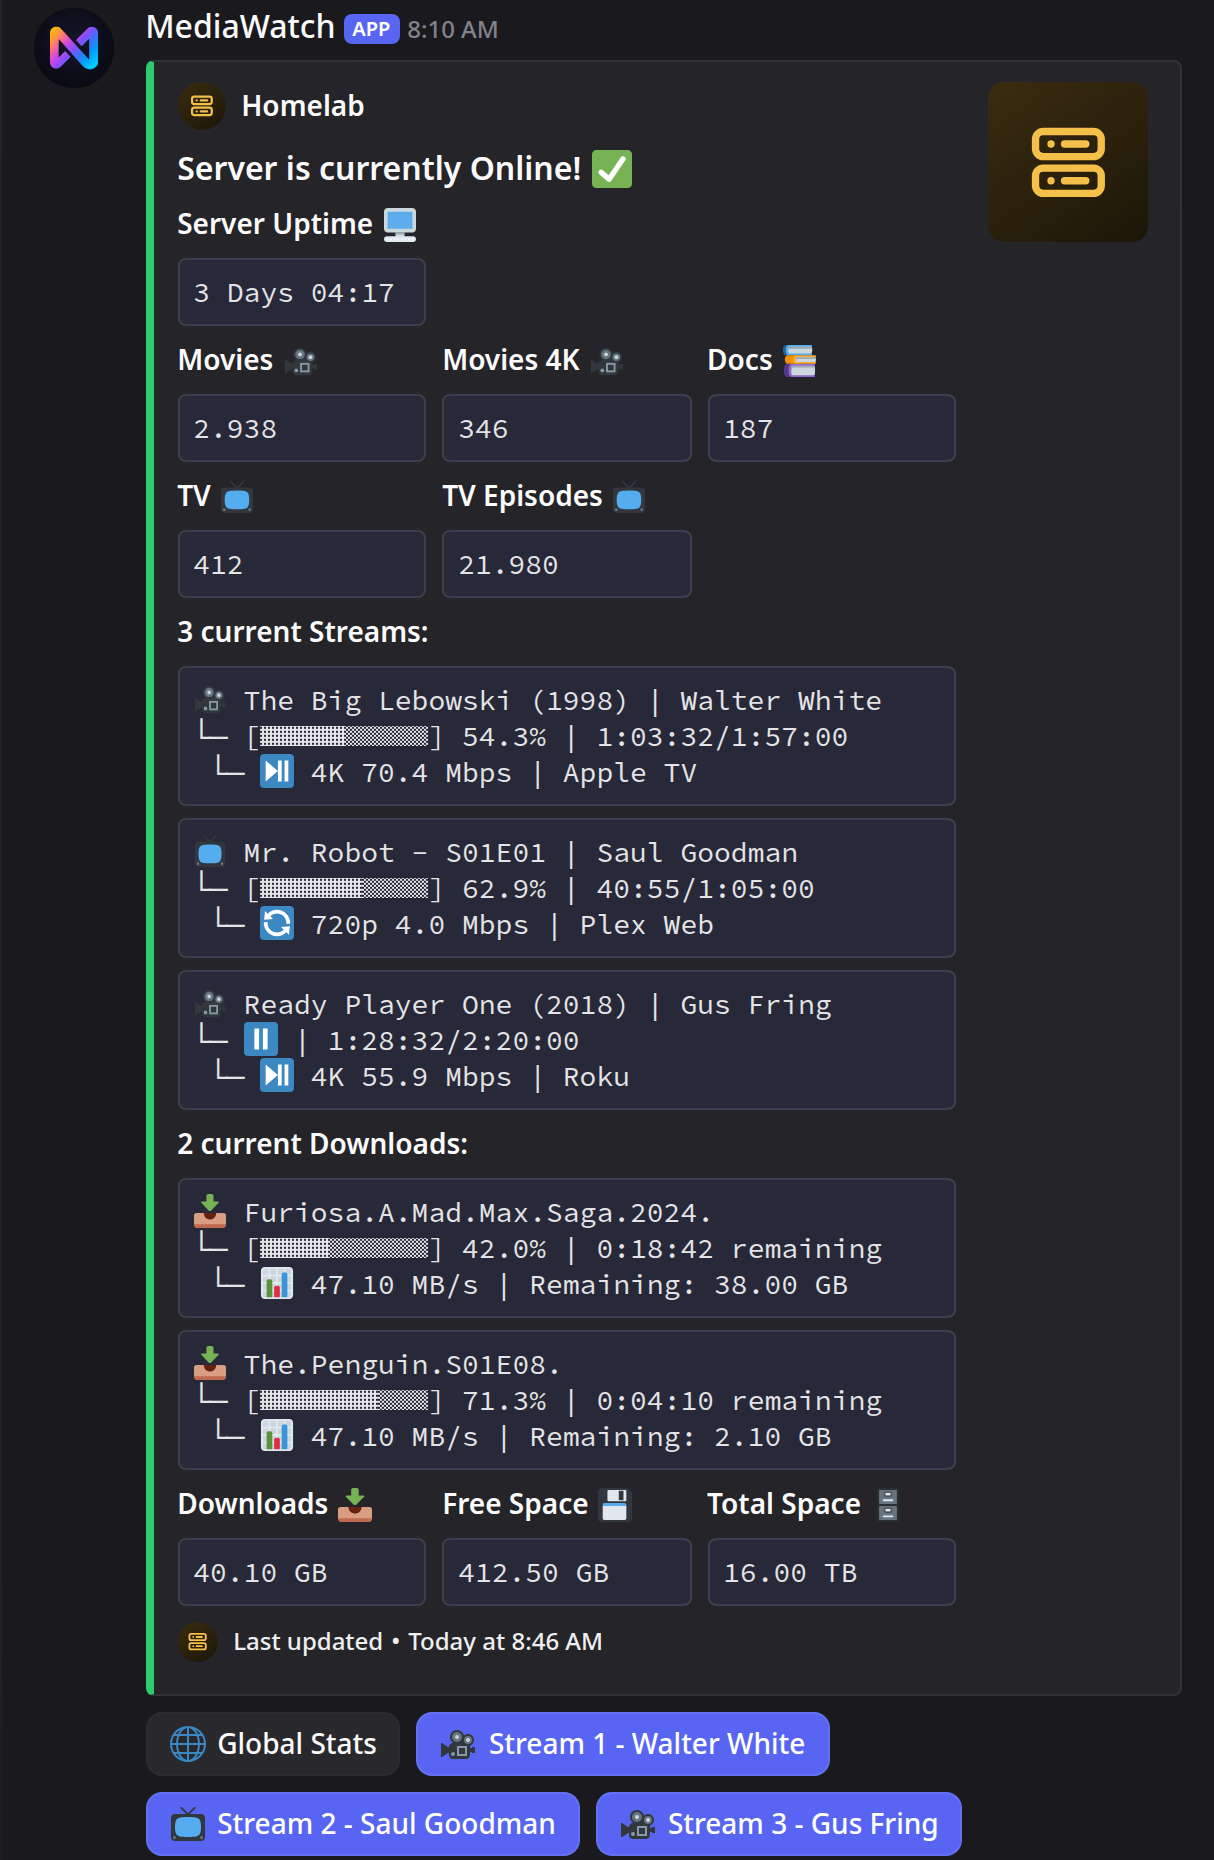
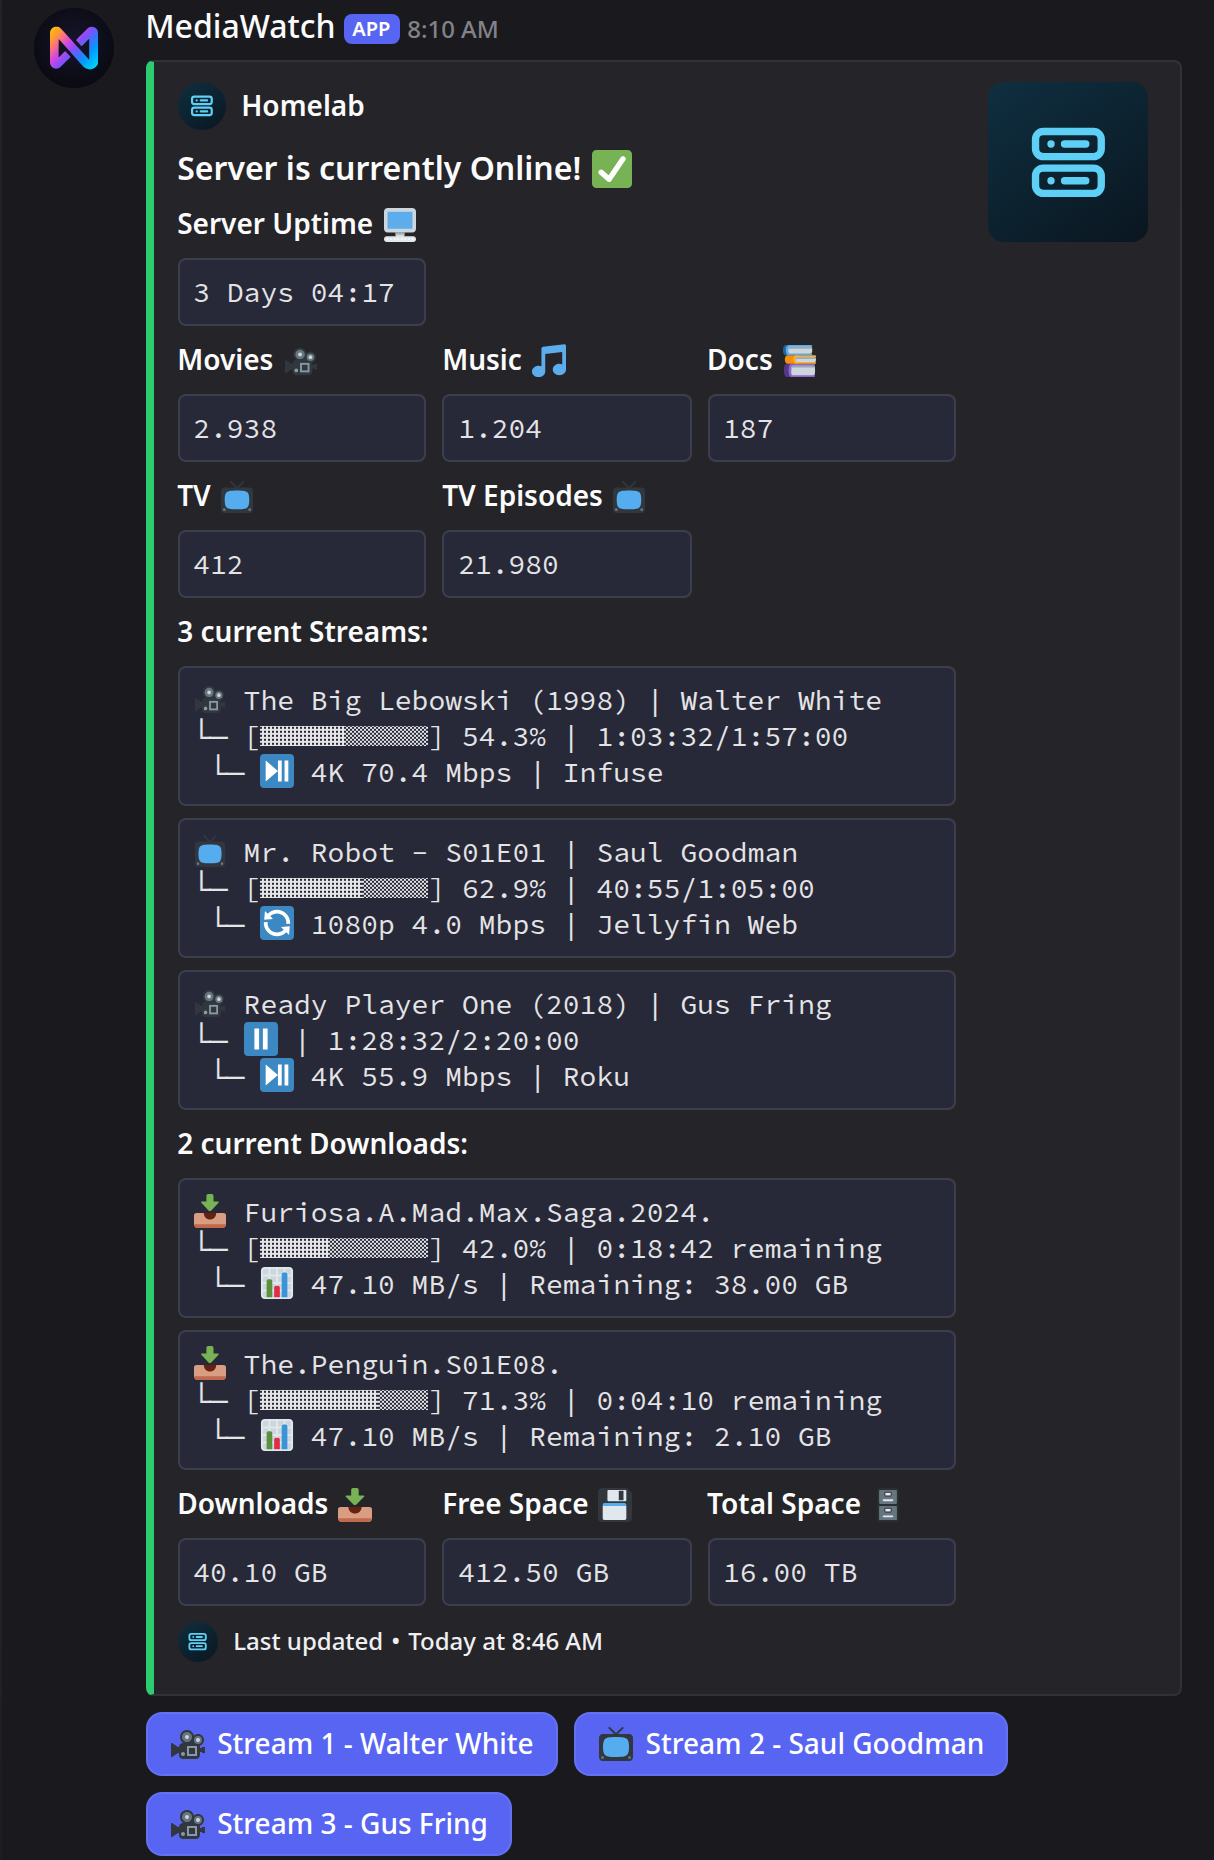
Title "Server is currently Online! ✅", green. The author line, thumbnail and footer
icon come from the dashboard block in data/config.yaml; the footer always reads
Last updated followed by the timestamp of the last edit.
| Section | What it shows |
|---|---|
Server Uptime 🖥️ |
How long MediaWatch has seen the server reachable without a break, not the server's own uptime. Persisted, so restarting the bot for an image update does not reset it; a longer absence drops it. See the uptime baseline. |
| One tile per library | The item count, plus a separate … Episodes 📺 tile for sections with show_episodes: true. Names and emoji come from your config; unconfigured sections follow in the order the server reports them. |
N current Streams: |
One code block per running stream: title, progress, quality and player. Quality is the resolution, or bit depth and sample rate for music (24bit 96kHz). Without streams the field reads Current Streams: / 💤 No active streams currently. |
N current Downloads: |
Only when SABnzbd is configured. Adds Downloads 📥, Free Space 💾 and Total Space 🗄️. With no queue the block is hidden, or with sabnzbd.show_when_empty: true reduced to Current Downloads: / 💤 No active downloads currently, without the three tiles. |
Uptime Kuma numbers are not in the online embed
The Uptime (24h) / (7 days) / (30 days) fields are only rendered while the
server is offline, because that is the moment the history is interesting. An online
dashboard shows no Uptime Kuma data even with the integration fully configured.
When the server is offline
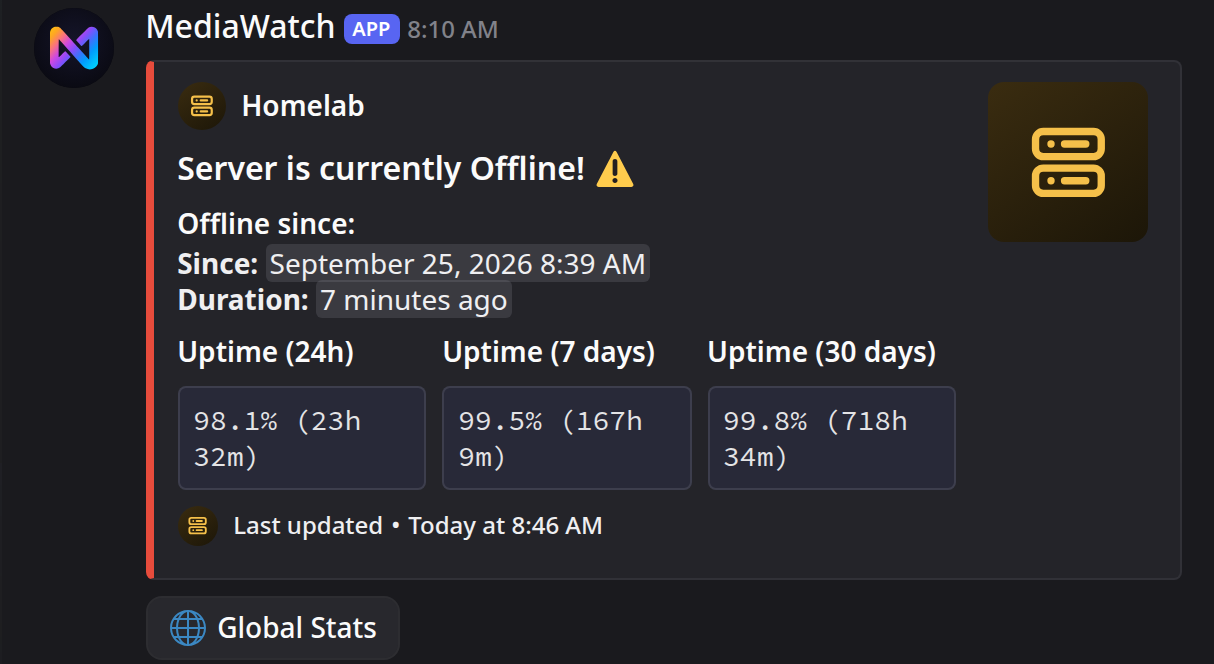
Title "Server is currently Offline! ⚠️", red. The libraries and stream list are dropped; what remains is:
Offline since:with Since as an absolute timestamp and Duration as a relative one. Both are Discord timestamps, so every reader sees them in their own timezone.Uptime (24h),Uptime (7 days),Uptime (30 days)when Uptime Kuma is configured and has data. Without it the three fields are omitted entirely.
Offline is delayed on purpose
server.offline_threshold (default 300 seconds) has to elapse before the embed
flips. Until it does, the dashboard keeps the online title with the last cached
library counts and an empty stream list, so a brief media server restart shows
up as "no one is watching", not as a red dashboard.
The delay only applies once the bot has reached the server since it started. If the server is already unreachable at startup, the dashboard shows offline immediately.
When the token is rejected
Title "Server rejected the credentials! ⛔", orange, with a single field:
Authentication failed: The server is reachable, but it rejected the credentials (HTTP 401/403). Check PLEX_TOKEN in your
.envfile and restart the bot. The media server itself is not down.
On Jellyfin the same field names JELLYFIN_API_KEY.
This is a state of its own since 2.0. In 1.x a wrong token looked exactly like an outage,
which sent people debugging a media server that was running fine. It is also reported
immediately and does not wait out offline_threshold, because a rejected credential
is not a transient failure. See
Troubleshooting.
The bot presence
The bot's status in the member list follows the same state, on its own five-minute loop:
| State | Presence text | Status |
|---|---|---|
| Offline | presence.offline_text, default 🔴 Server Offline! |
presence.offline_status, default Do Not Disturb |
| Credentials rejected | presence.auth_failed_text, falling back to presence.offline_text |
presence.offline_status |
| Online, at least one stream | presence.stream_text, default {count} active Stream{s} 🟢 |
Online |
| Online, no streams | The library counts listed under presence.libraries, joined by a vertical bar |
Online |
| Online, no streams, no libraries configured | No streams or libraries configured |
Online |
Two honest details: the presence loop runs every five minutes while the dashboard runs
every minute, so the presence can lag behind the embed by up to five minutes. And by
default a rejected token shows offline_text like a real outage; set
presence.auth_failed_text to tell the two apart in the presence as well.
The buttons
The dashboard carries up to nine buttons, all of which answer ephemerally: only the person who clicked sees the result.
| Button | Appears when | What it does |
|---|---|---|
Stream N - User |
A stream is running (one per stream, max 8). Names longer than 15 characters are cut to 12 plus ... |
Opens the details for that stream: device, player, quality, transcode decision, tracks |
🌐 Global Stats |
Plex with Tautulli, and global_stats.button_location is dashboard or both |
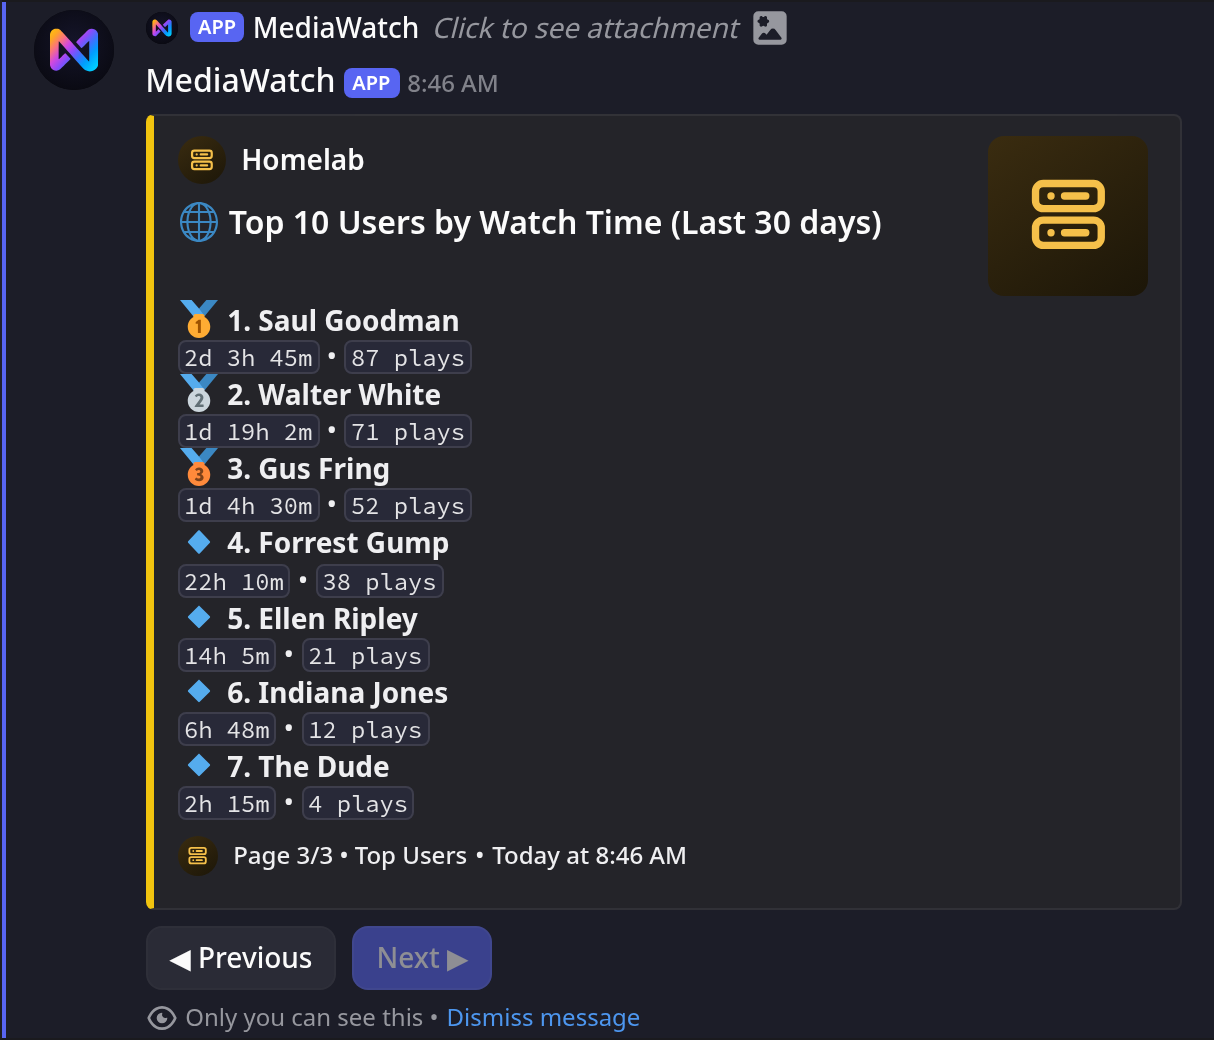
Opens the paginated server-wide statistics |
Inside the ephemeral stream details there can be up to four more:
| Button | Appears when |
|---|---|
🌐 Global Stats |
Plex with Tautulli and button_location is stream_details (the default) or both |
📊 User Stats |
Plex with Tautulli, and Tautulli knows the user behind the session. With user_stats.enabled: false the button still appears and answers ❌ User statistics feature is disabled. user_stats.restrict_to_authorized limits it to authorized users |
▶️ Plex |
Plex with Tautulli, unless stream_details.links.plex.enabled is false. It rides along with the details embed, so a Tautulli outage takes it with it |
⛔ Kill Stream |
The clicking user is in DISCORD_AUTHORIZED_USERS. Opens a modal for the termination message |
Plex is a link button: it opens the played item in Plex Web, or in the Plex app on a
phone, and triggers nothing in the bot. The title of the details embed links to the
same place. Music opens the album, because Plex Web has no page for a single track. Icon,
target URL and on/off live in
stream_details.links.plex. Pointing
base_url at your own Plex Web drops the hand-off to the phone app.
On Jellyfin the stream details carry Kill Stream only, and not at all when the details
fail to load. Global and user statistics are Tautulli-backed and the Plex link is, too. On
Plex, Kill Stream stays available even when Tautulli cannot deliver the details.
On Plex the per-stream buttons need either Tautulli or at least one authorized user; with neither, there is nothing behind them and they are not attached. Jellyfin always attaches them. The dashboard buttons themselves never expire. The buttons inside the stream details stop responding after five minutes, the page buttons of the user and global statistics after three. Click the dashboard button again.
What the buttons open
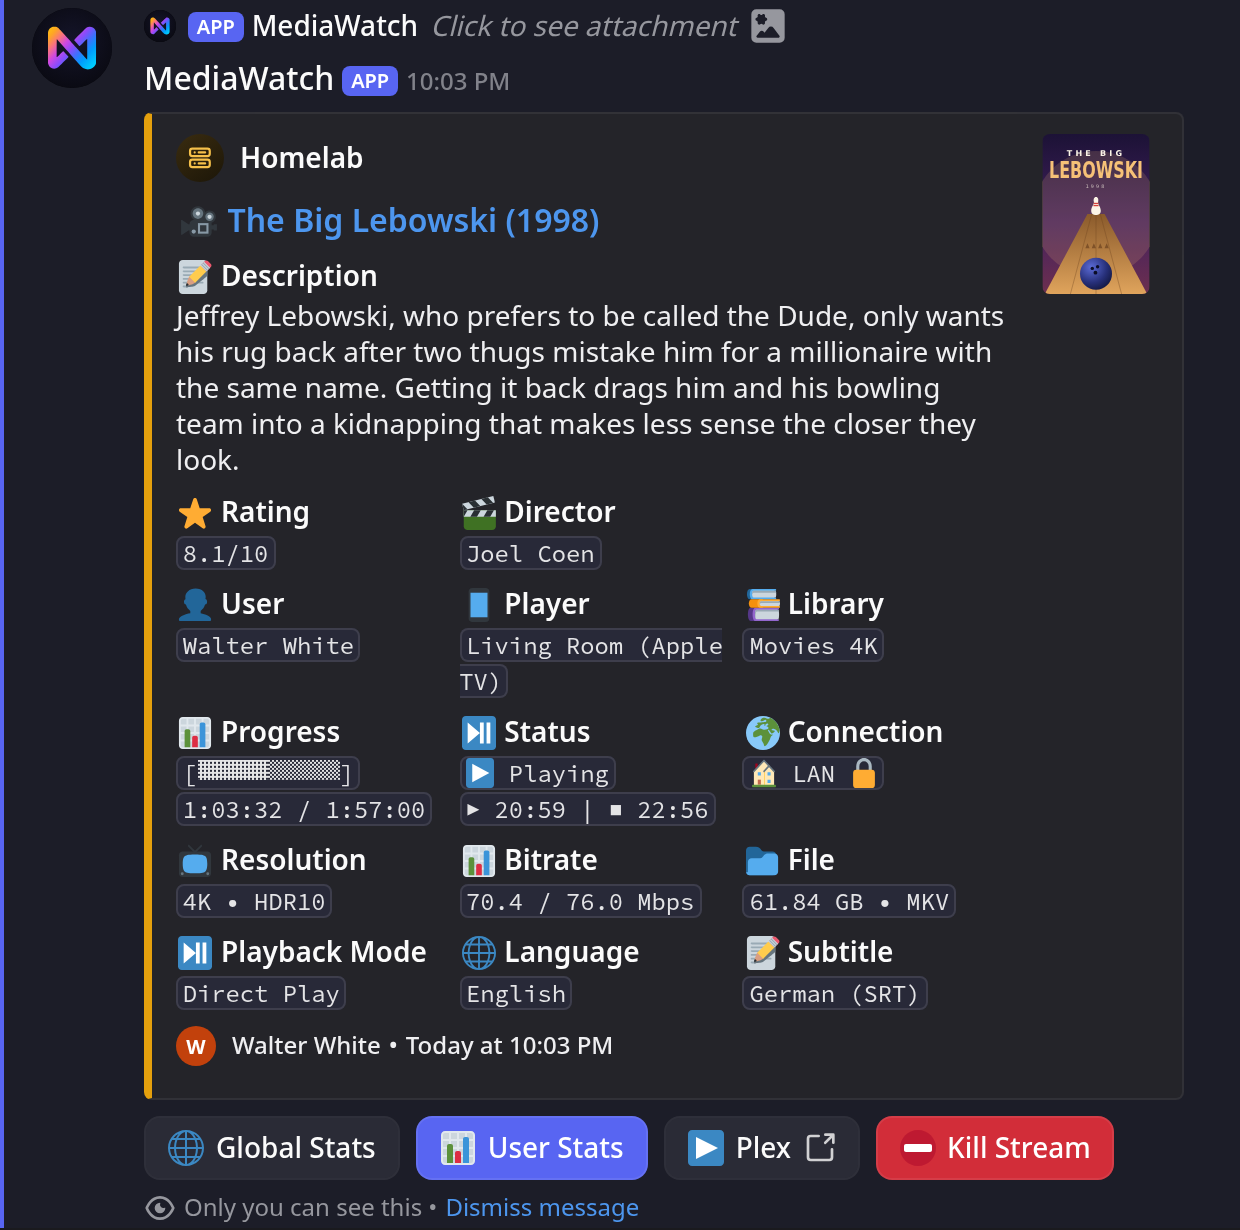
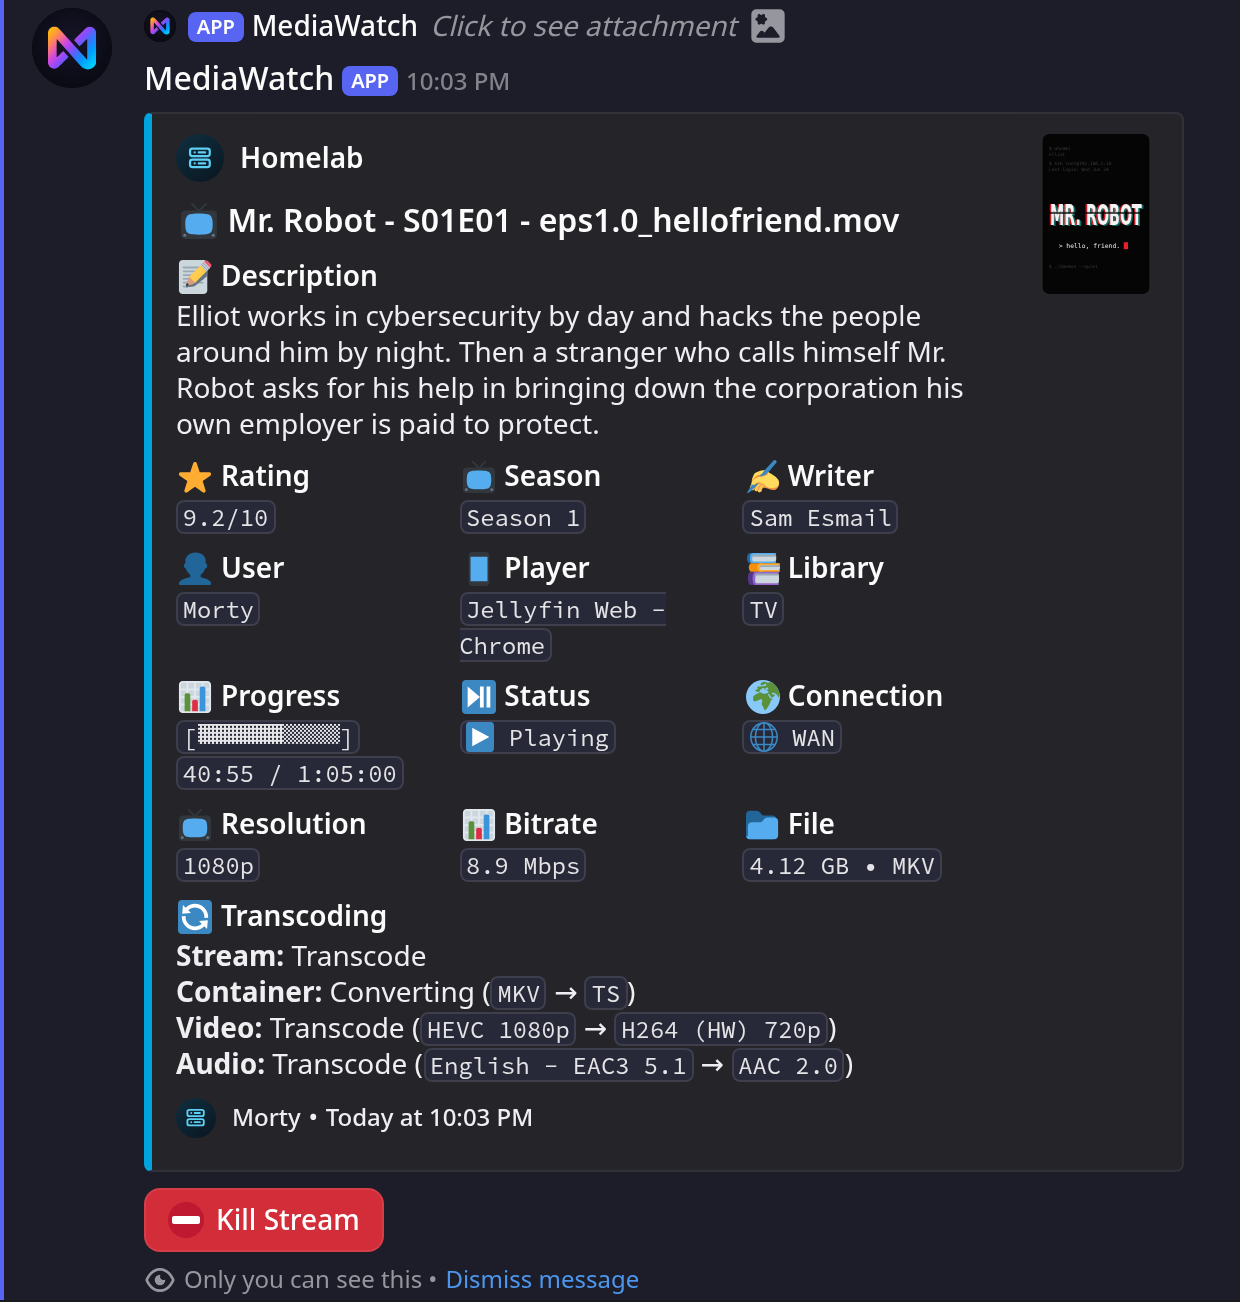
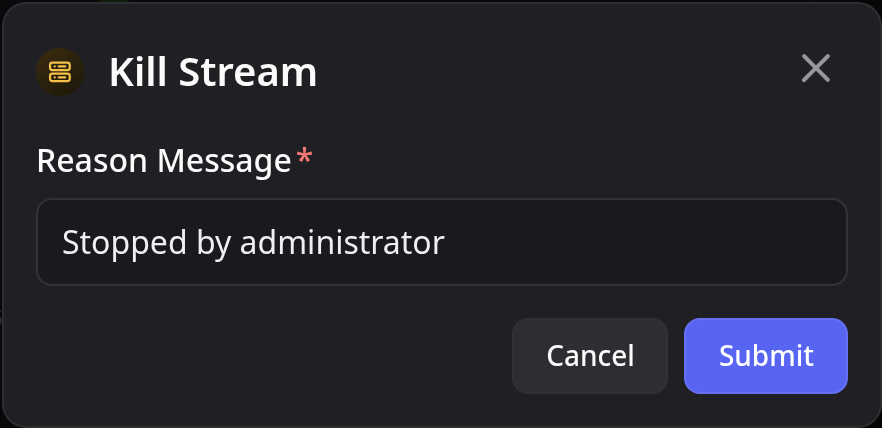
The modal takes the message the viewer sees; it is prefilled with
stream_controls.kill_stream.default_reason.
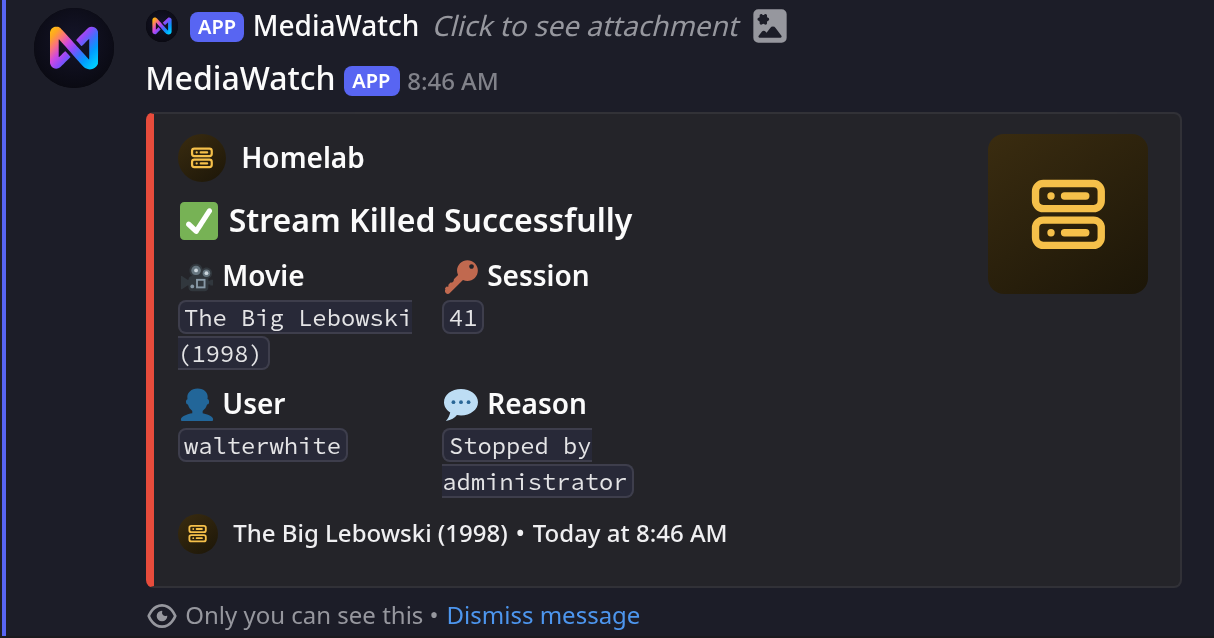
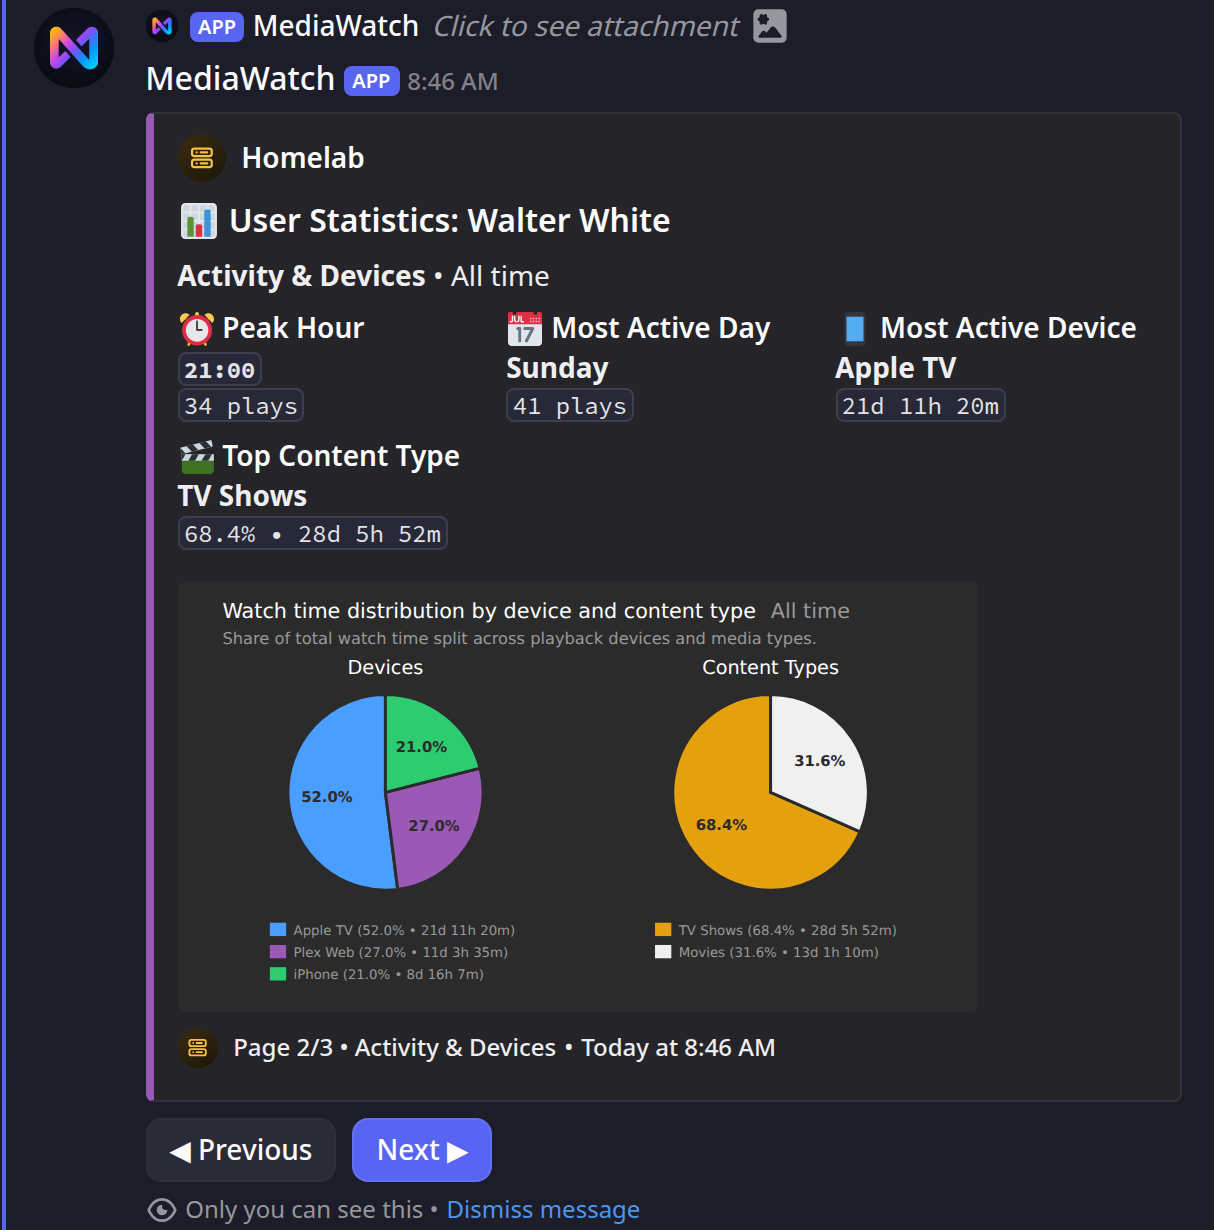
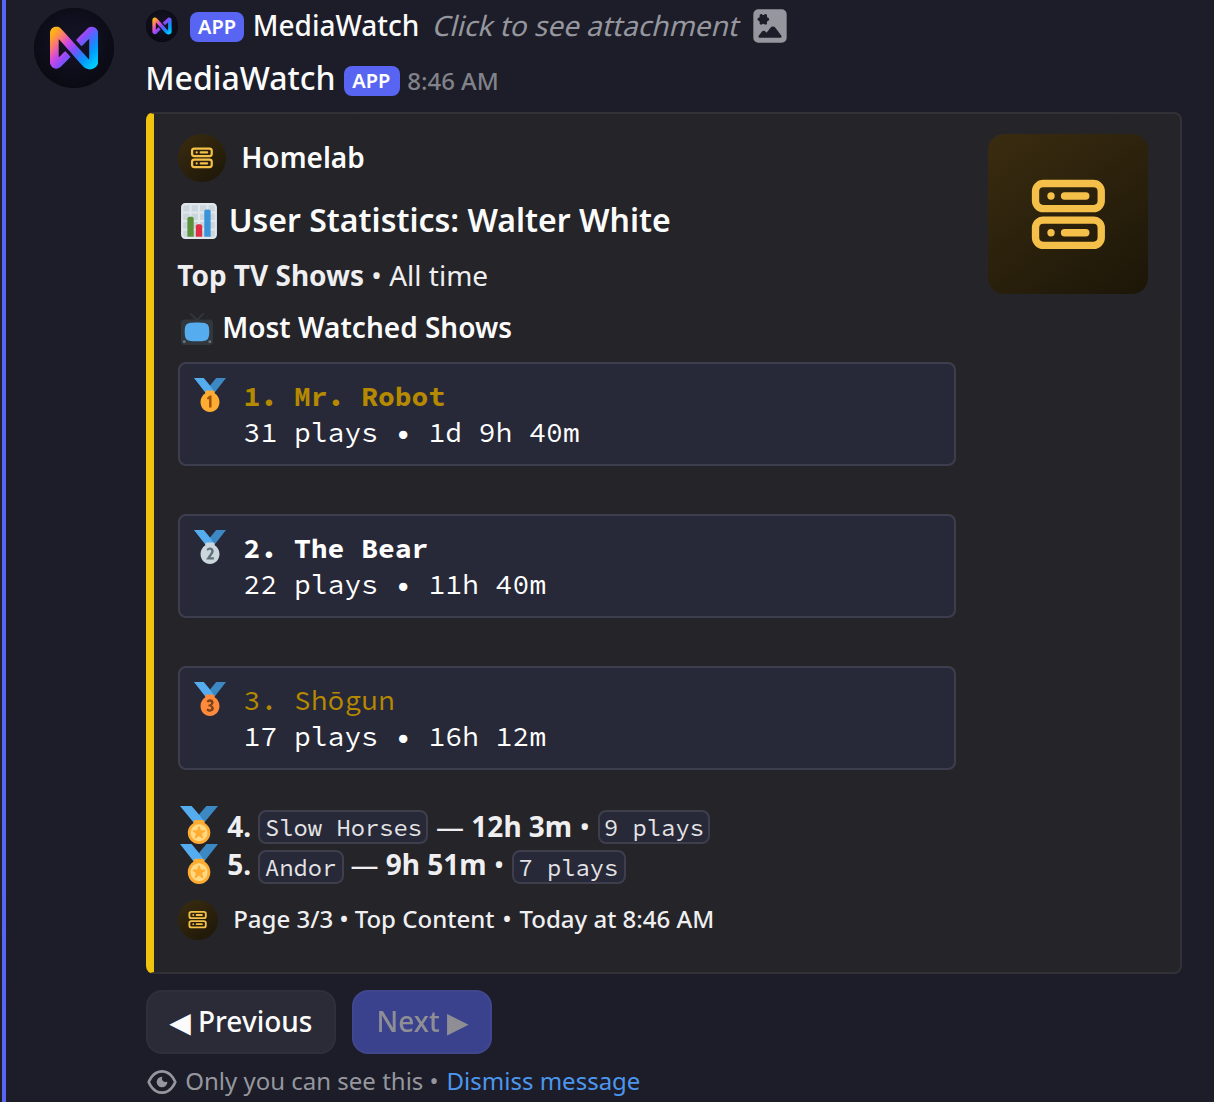
Three pages: watch behaviour, activity and devices, top content.
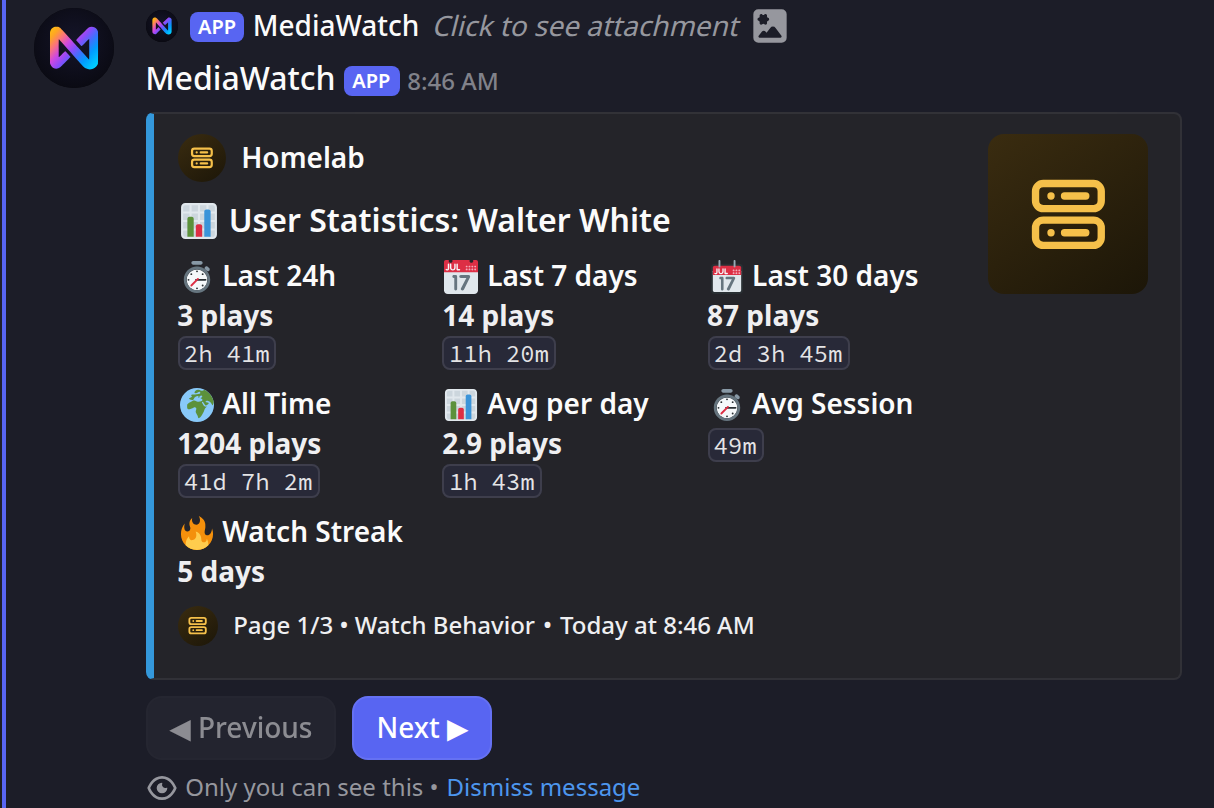
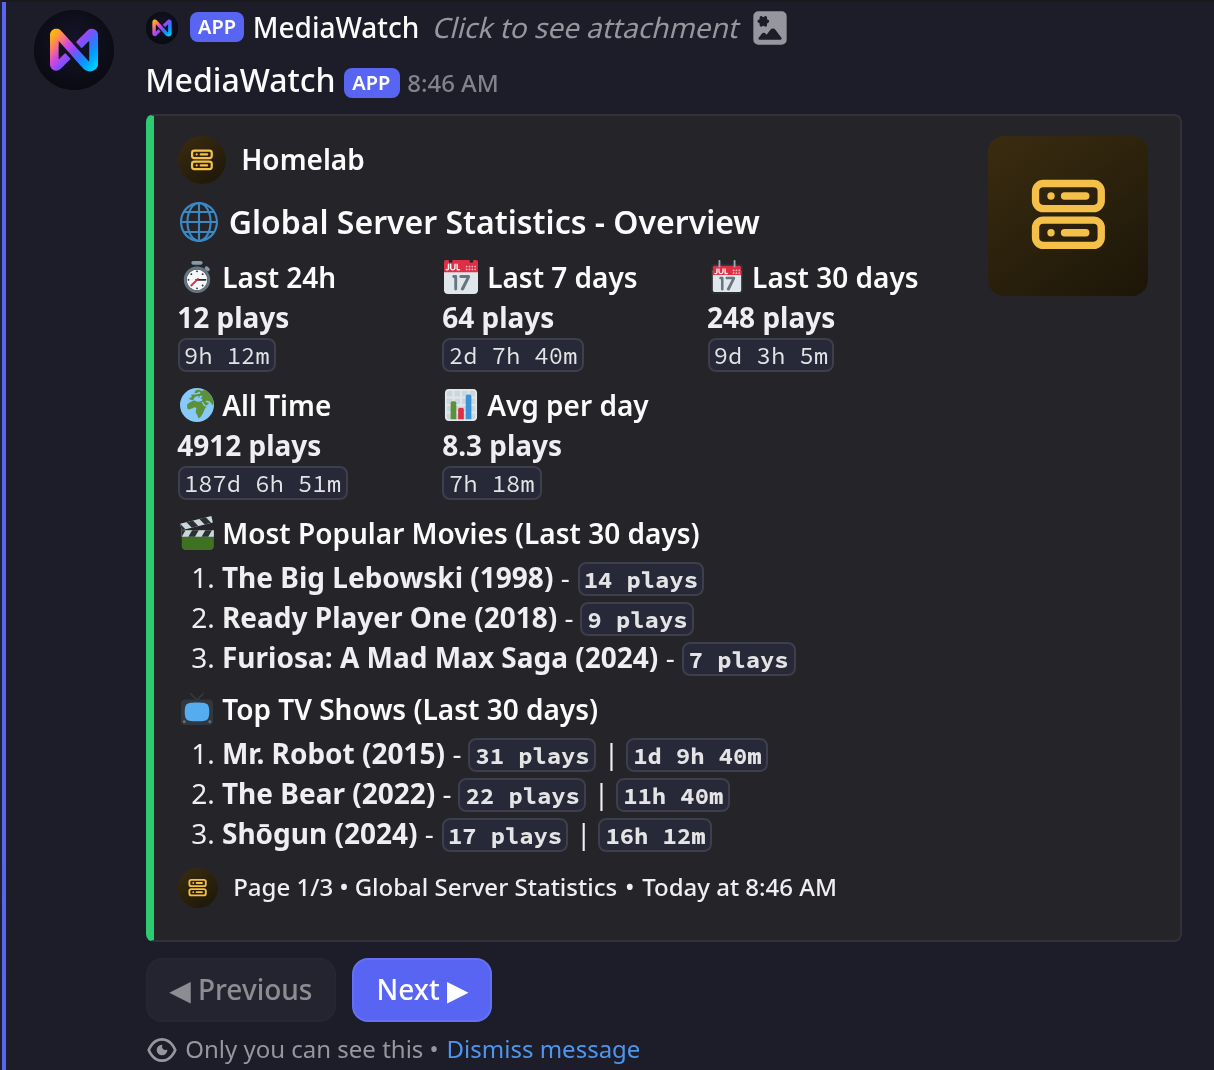
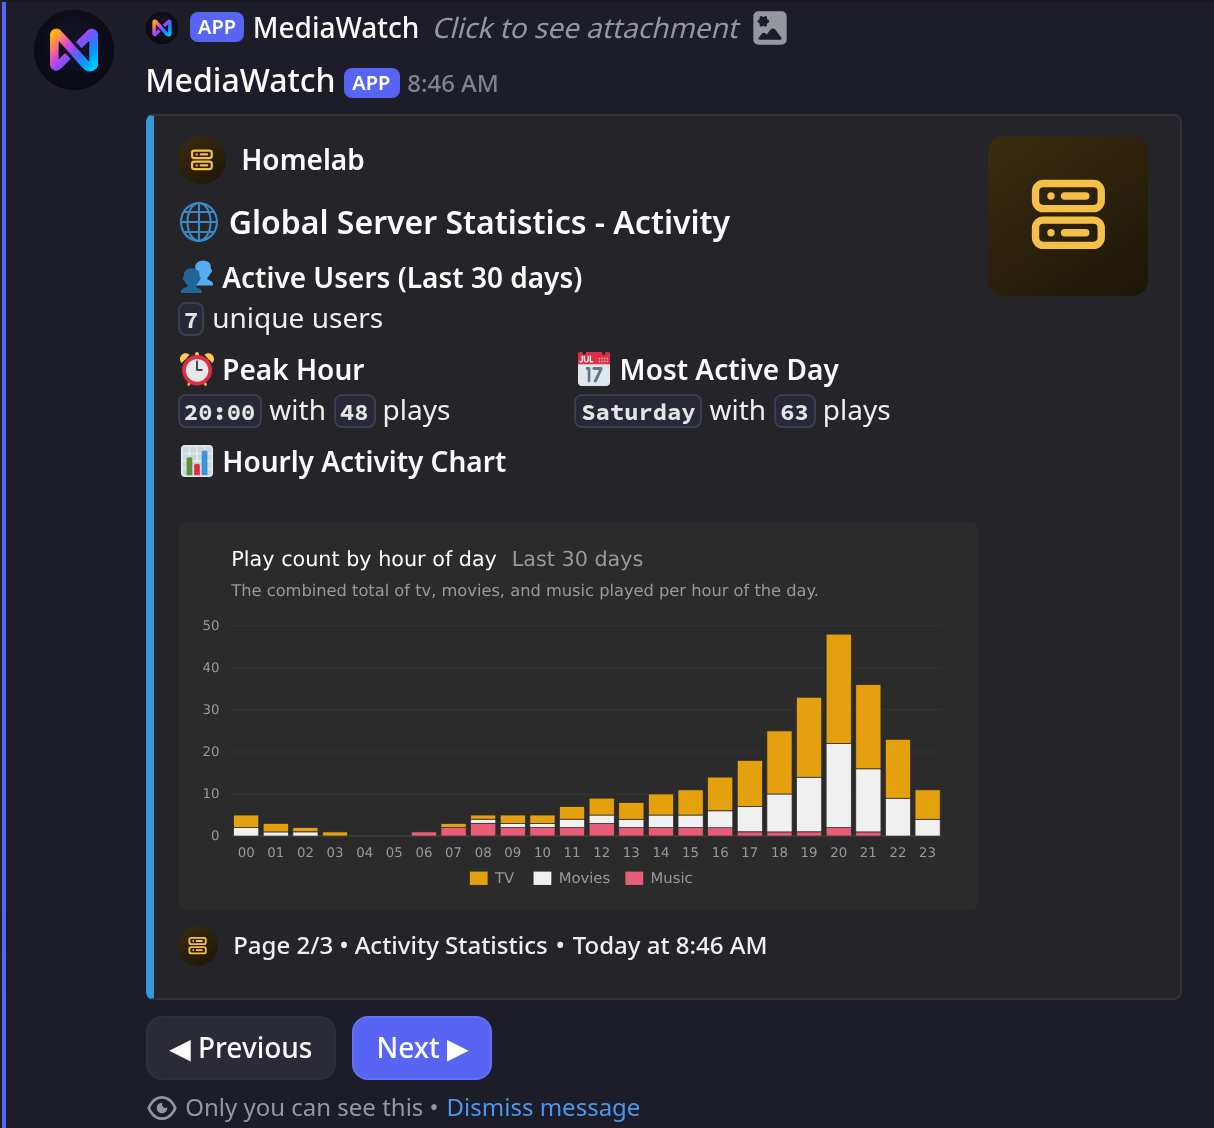
Three pages: overview, hourly activity, top users.
By default everyone in the channel can press these
Both Stream N and Global Stats are open to every channel member unless you say
otherwise. See Privacy and visibility.
Known limits
These are Discord's limits, not arbitrary choices: an embed accepts at most 25 fields, 1024 characters per field value and 6000 characters in total. Exceeding any of them makes Discord reject the whole update, which would freeze the dashboard silently.
- At most 8 streams are listed, and at most 8 stream buttons are attached. The field
header says so instead of hiding it:
12 current Streams: (showing 8 of 12). - At most 15 library fields. A section with
show_episodes: trueconsumes two of them. When sections are dropped, a line(showing 6 of 9 libraries)is added below the tiles. - The stream list can be cut below 8 when the blocks are long, because the field value budget is shared with the downloads block. The number in the header is what was actually rendered, not a fixed 8.
- At most 4 downloads are listed. Like the stream list, the header says so: a queue of
six reads
6 current Downloads: (showing 4 of 6). The size, free space and total space tiles below always cover the whole queue. - Library totals are cached for
cache.library_update_intervalseconds (default 900), so a newly added library can take up to 15 minutes to appear. - Uptime Kuma data appears only in the offline embed, as noted above.
If you regularly exceed the 15-field cap, set show_all: false and list the sections you
actually want in the plex: / jellyfin: block. See the
configuration reference.